Revealing the truth behind risk
Product design for SHARP55, a conduct intelligence layer that reveals invisible risks across credit, legal, logistics, HR, and operations
Client
SHARP55
My Role
- UX Strategy
- Website
- B2B
- User Research
- End-to-End
- UI
Timeline
2025
Team
- 1 Product Designer
- 1 Software Engineer
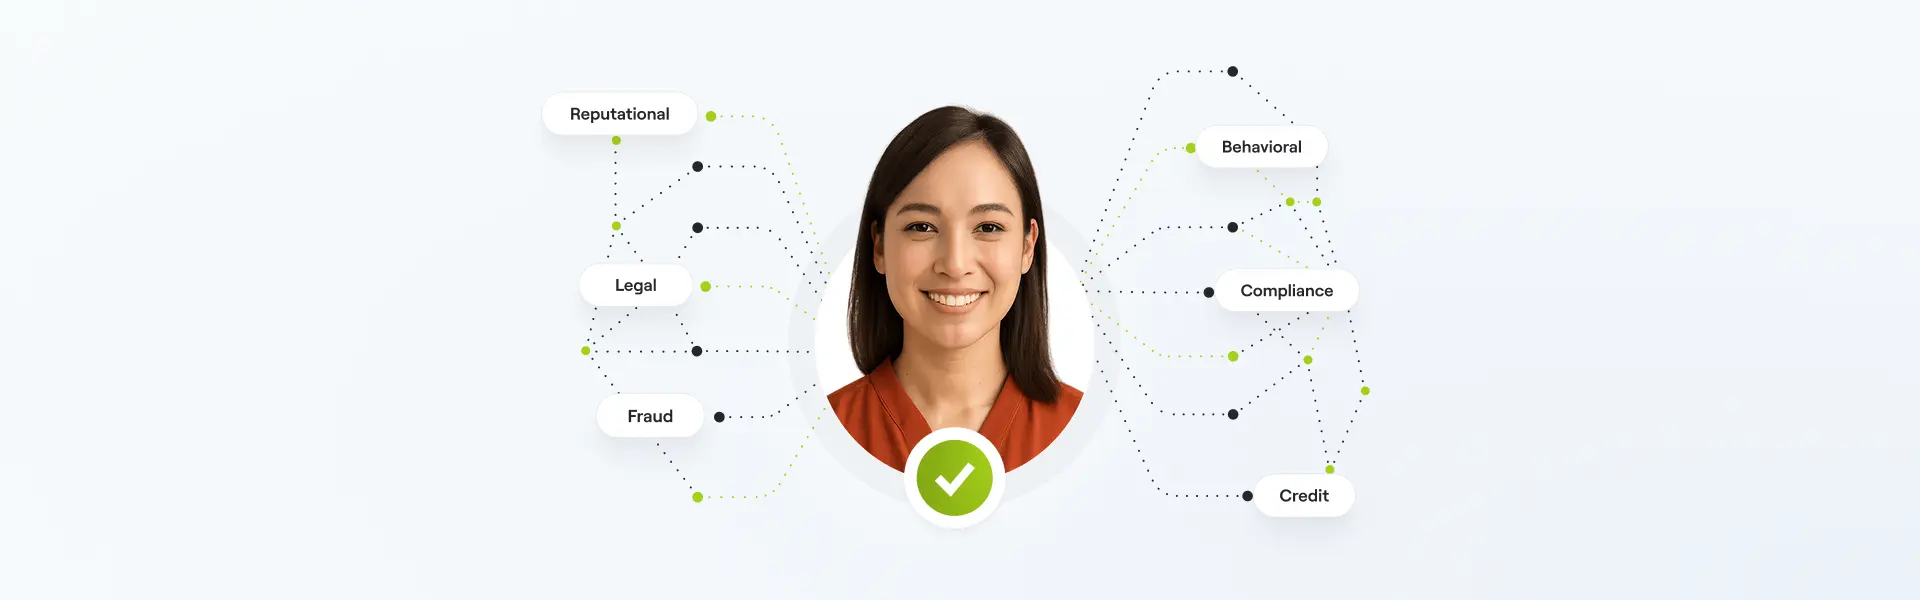
Most companies still decide who to trust based on financial scores. But scores only show part of the picture. SHARP55 was built to reveal what traditional models miss: patterns of conduct, judicial history, and behavioral deviations that precede losses across credit, fraud, default, registration, legal, HR, logistics, and operations.
Rather than replacing existing systems, SHARP55 acts as an intelligence layer. It integrates with the ERPs, CRMs, and decision engines that enterprises already use, amplifying their view of risk with predictive conduct analysis and real-time alerts.
The design challenge: transform a technically complex, algorithmic product into a clear, trusted experience. The product needed to speak with authority to executives, while giving analysts the depth they needed to trust what they saw.
As Design Lead, I structured the interface, design system, and messaging around five pillars: conduct as truth, exponential speed, measurable impact, decision transparency, and simple integration. The result is a product that doesn't just display data — it teaches users how to read risk differently.
- Predictive conduct analysis. Maps recurrence, transactional behavior, and hidden risk before default or failure occurs.
- Integrated legal and reputational data. Reads processes, protests, and pending issues across multiple risk domains.
- Intelligent alerts. Generates early warnings when behavioral patterns or operational risks shift.
- High-speed decisions. Processes analysis up to 10,000× faster through intelligent automation.
- Clear, traceable justifications. Every insight is documented with behavioral and legal evidence.
- Simple integration APIs. Direct connectivity with ERPs, CRMs, and decision engines.
Enterprises were making high-stakes decisions based on incomplete signals. Scores captured financial history, but ignored reincident behaviors, judicial risks, and operational deviations. The real warning signs only appeared after the damage was done.
The cost was structural: analysts spent weeks cross-referencing disconnected tools, decisions lacked traceability, and the same patterns repeated across credit, legal, logistics, and HR.
The market offered more data, but not better answers. Where competitors added complexity, SHARP55 chose clarity — teaching the market to read behavior as the truest signal of risk.
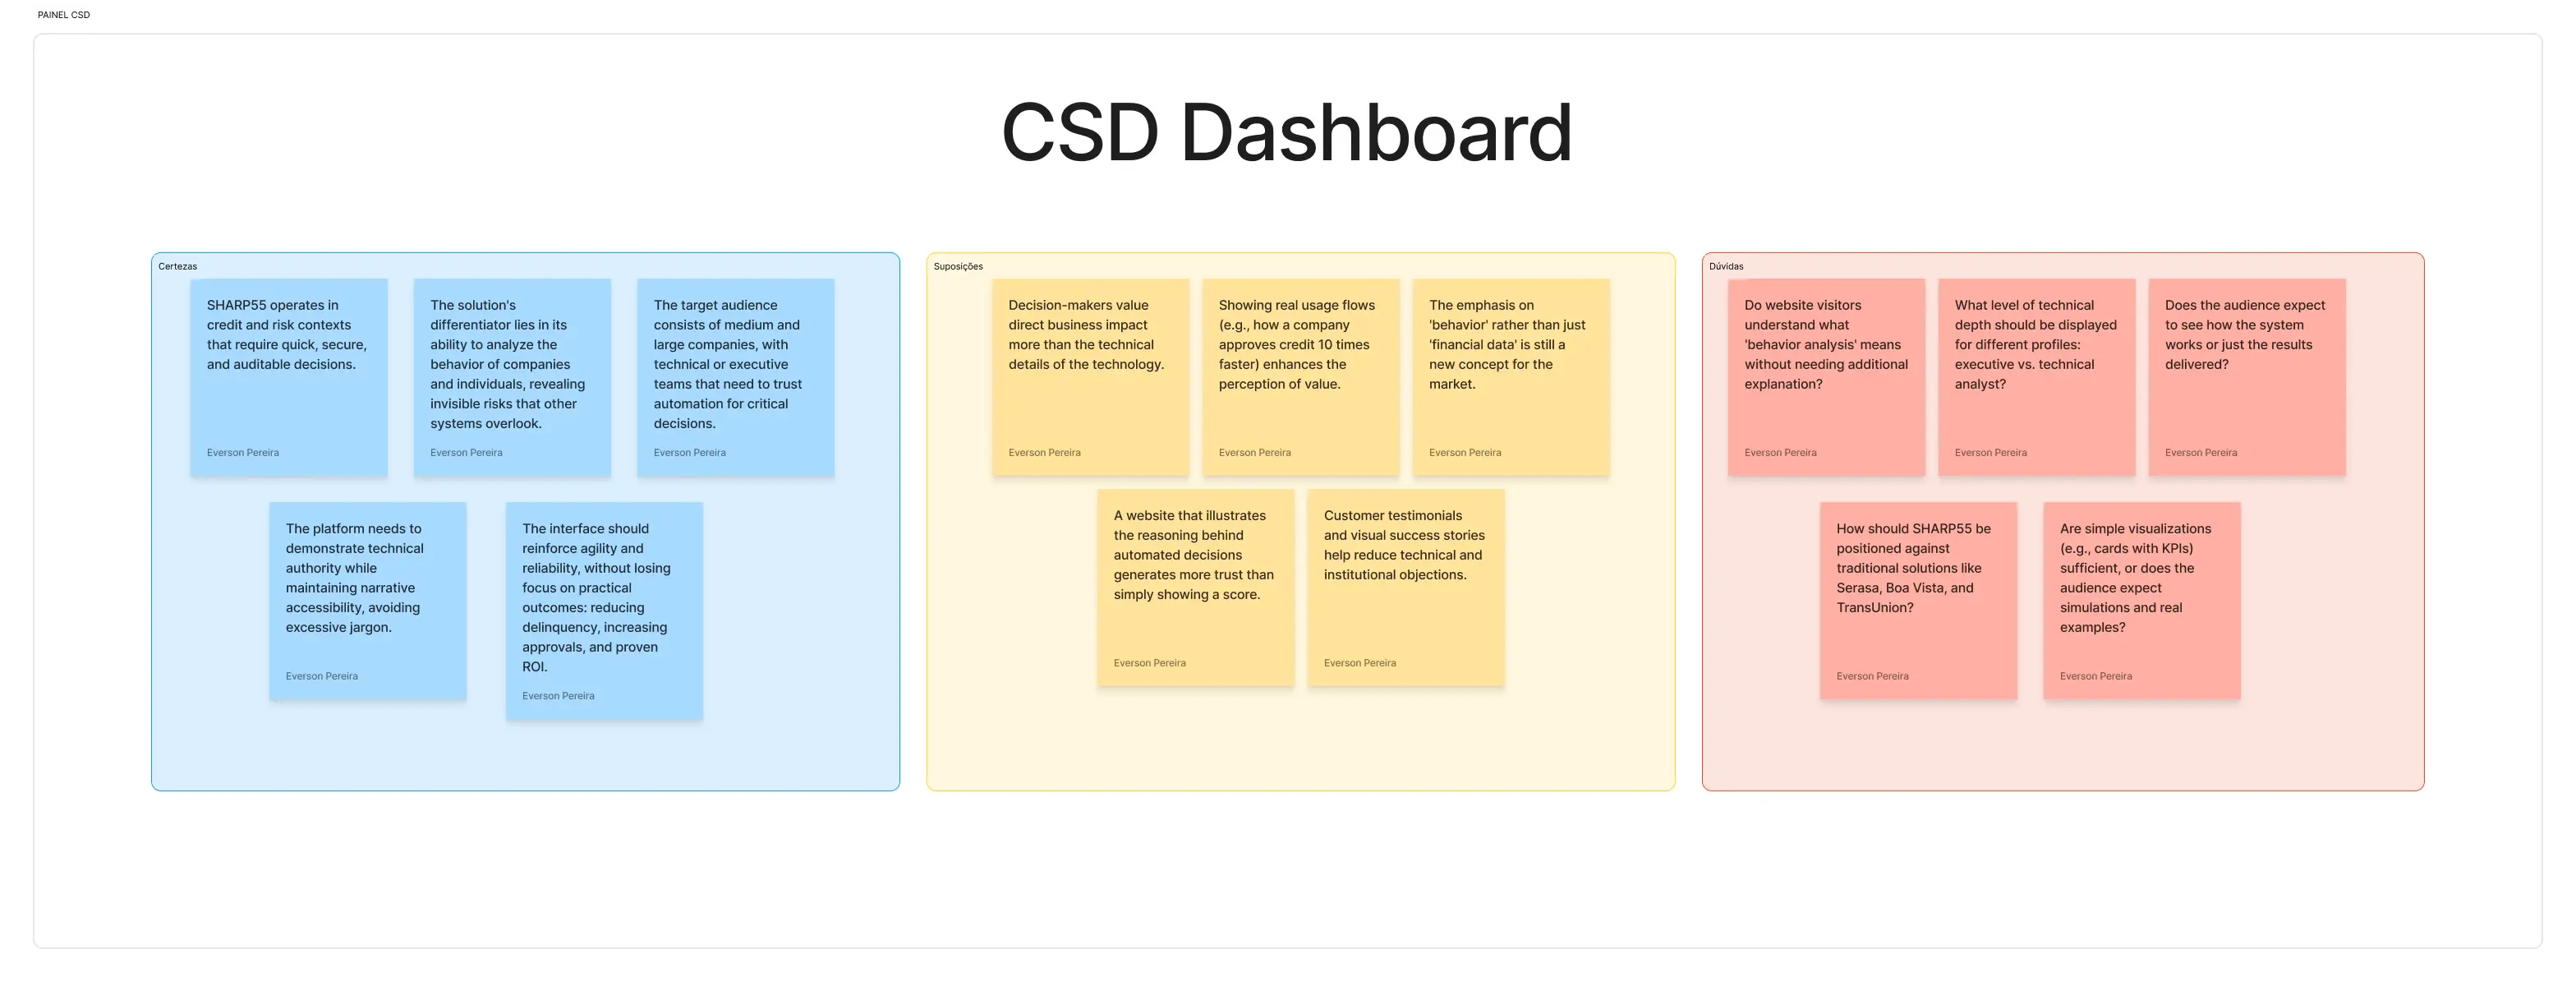
Before designing screens, I needed to understand what the product actually meant to the people who would buy and use it. We mapped what we knew, what we assumed, and what we still had to prove — then validated those assumptions through research and benchmarking.
We knew SHARP55 revealed hidden risks by analyzing behavioral conduct, and that its value was proven in enterprise use. We assumed the term “conduct” might need context, and that use cases would clarify more than technical specs. We didn’t know how far we could push abstract terms like “invisible risk”, or how much legal depth users expect before they lose interest.
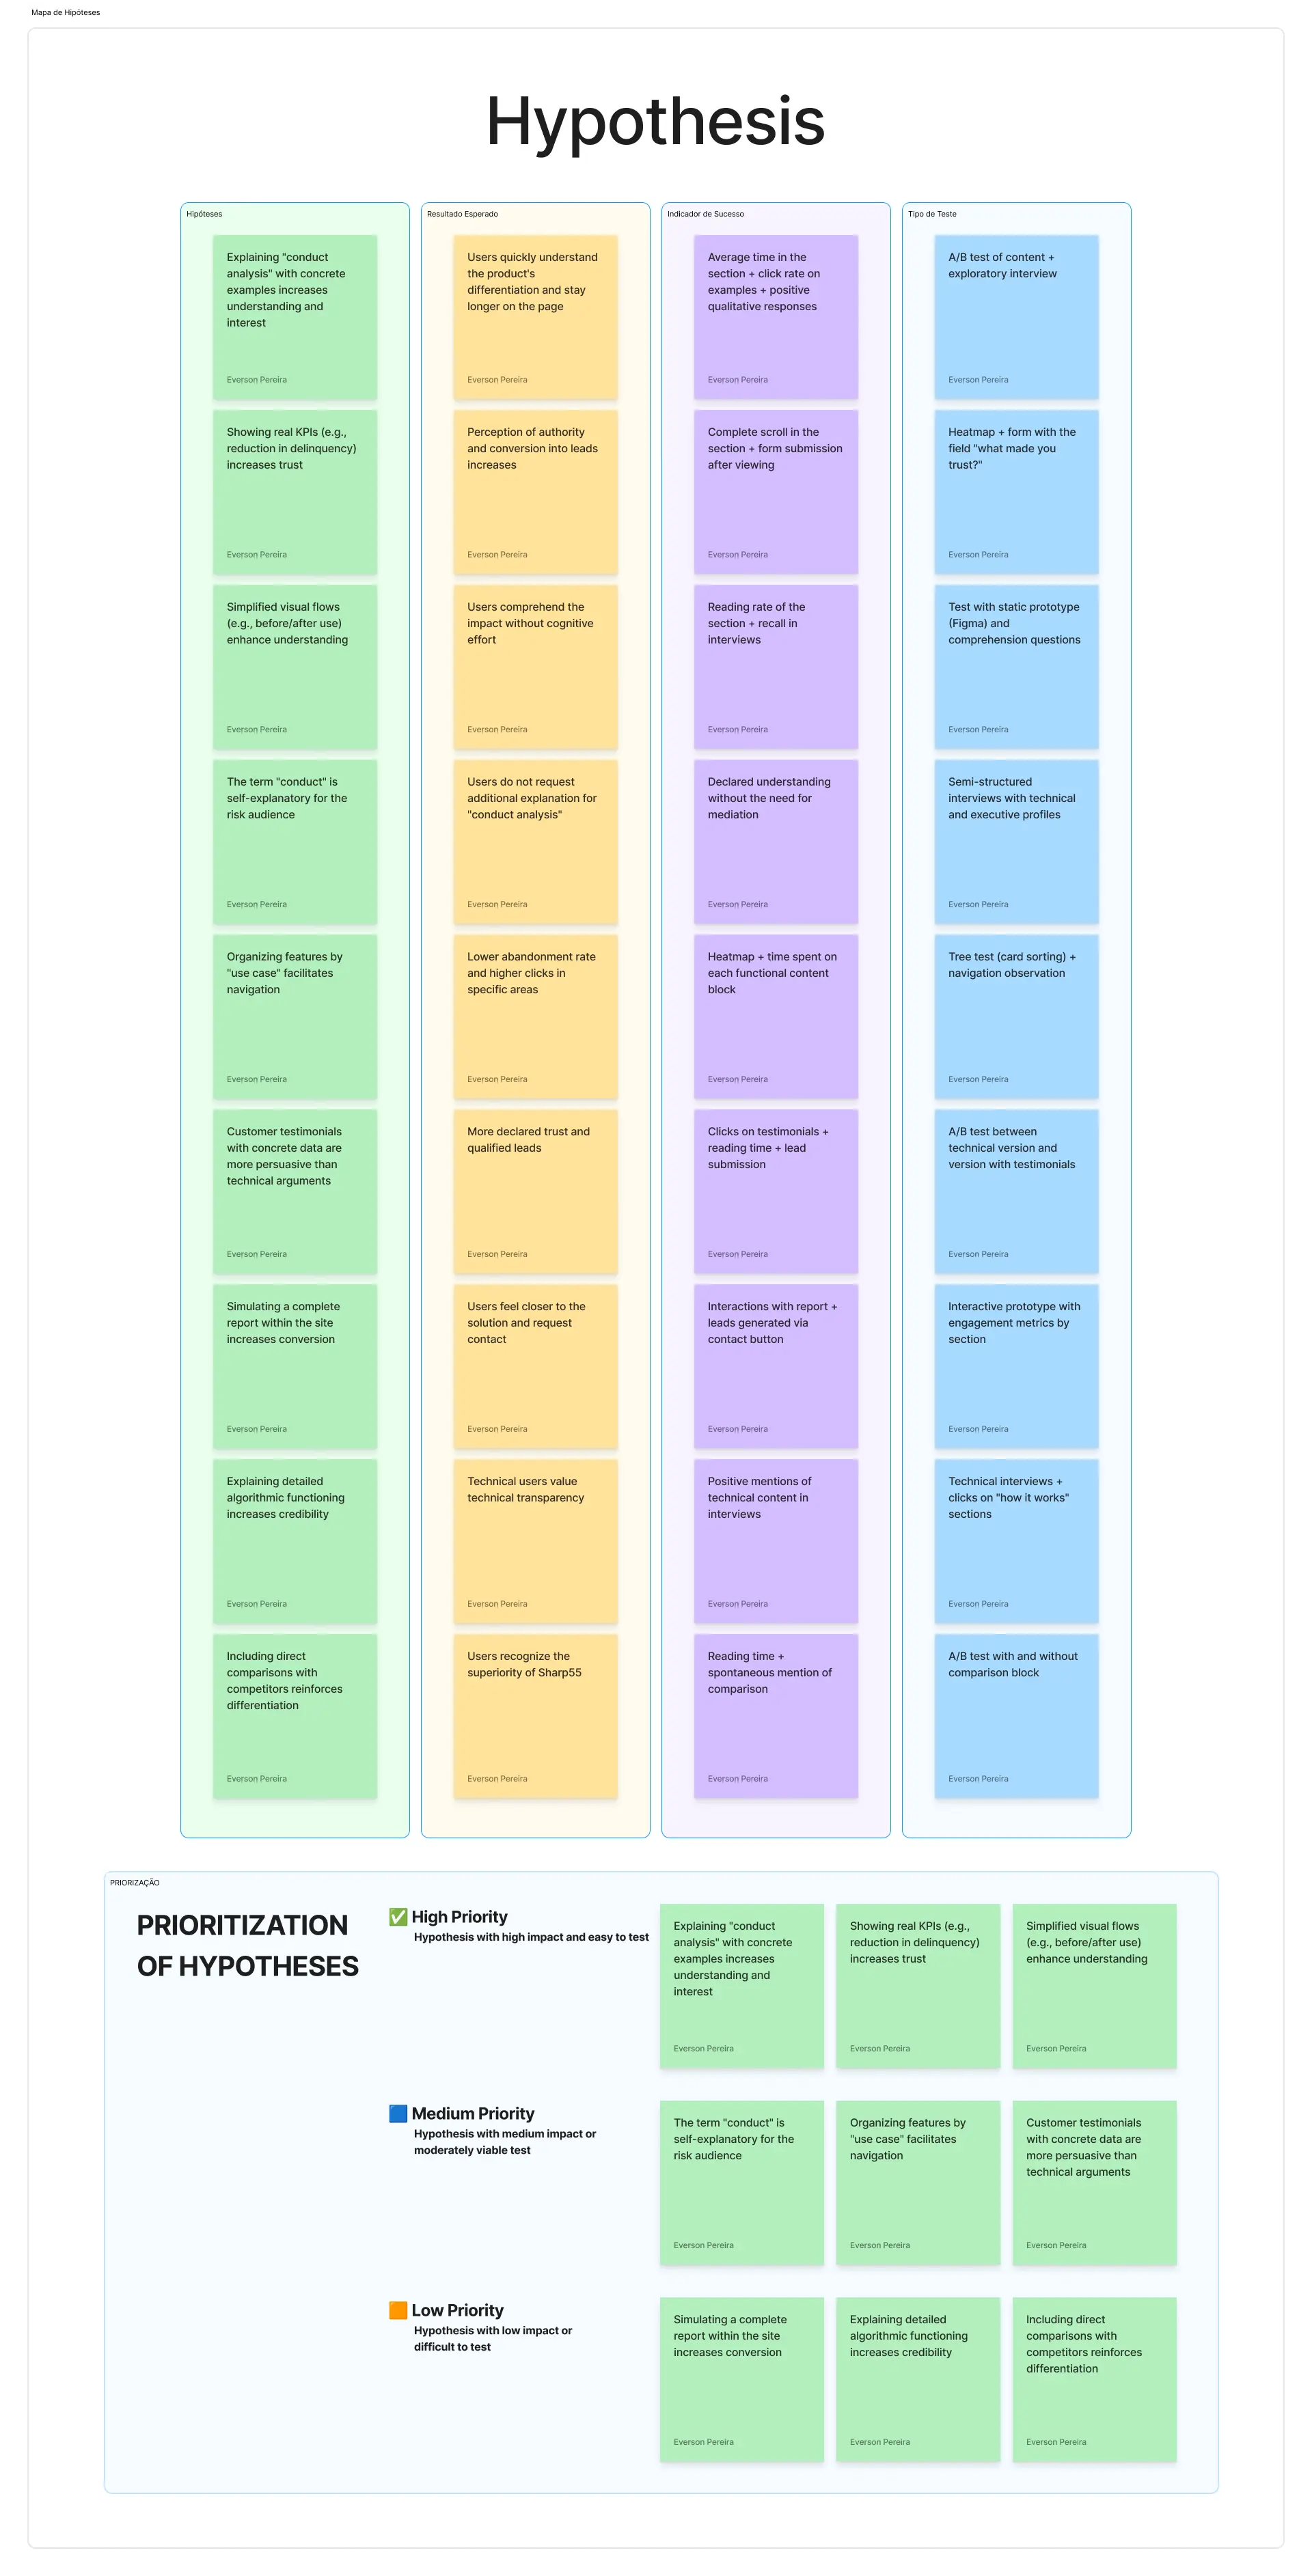
To bridge assumptions and outcomes, I converted each insight into clear, testable hypotheses. Each hypothesis was evaluated based on impact and test effort, forming a prioritization matrix that guided what to validate first. We focused on high-impact, low-effort hypotheses to quickly align messaging, interface and value perception around what truly drives decision-making.
This strategic framing ensured that every design decision could be linked to evidence, not just preference.
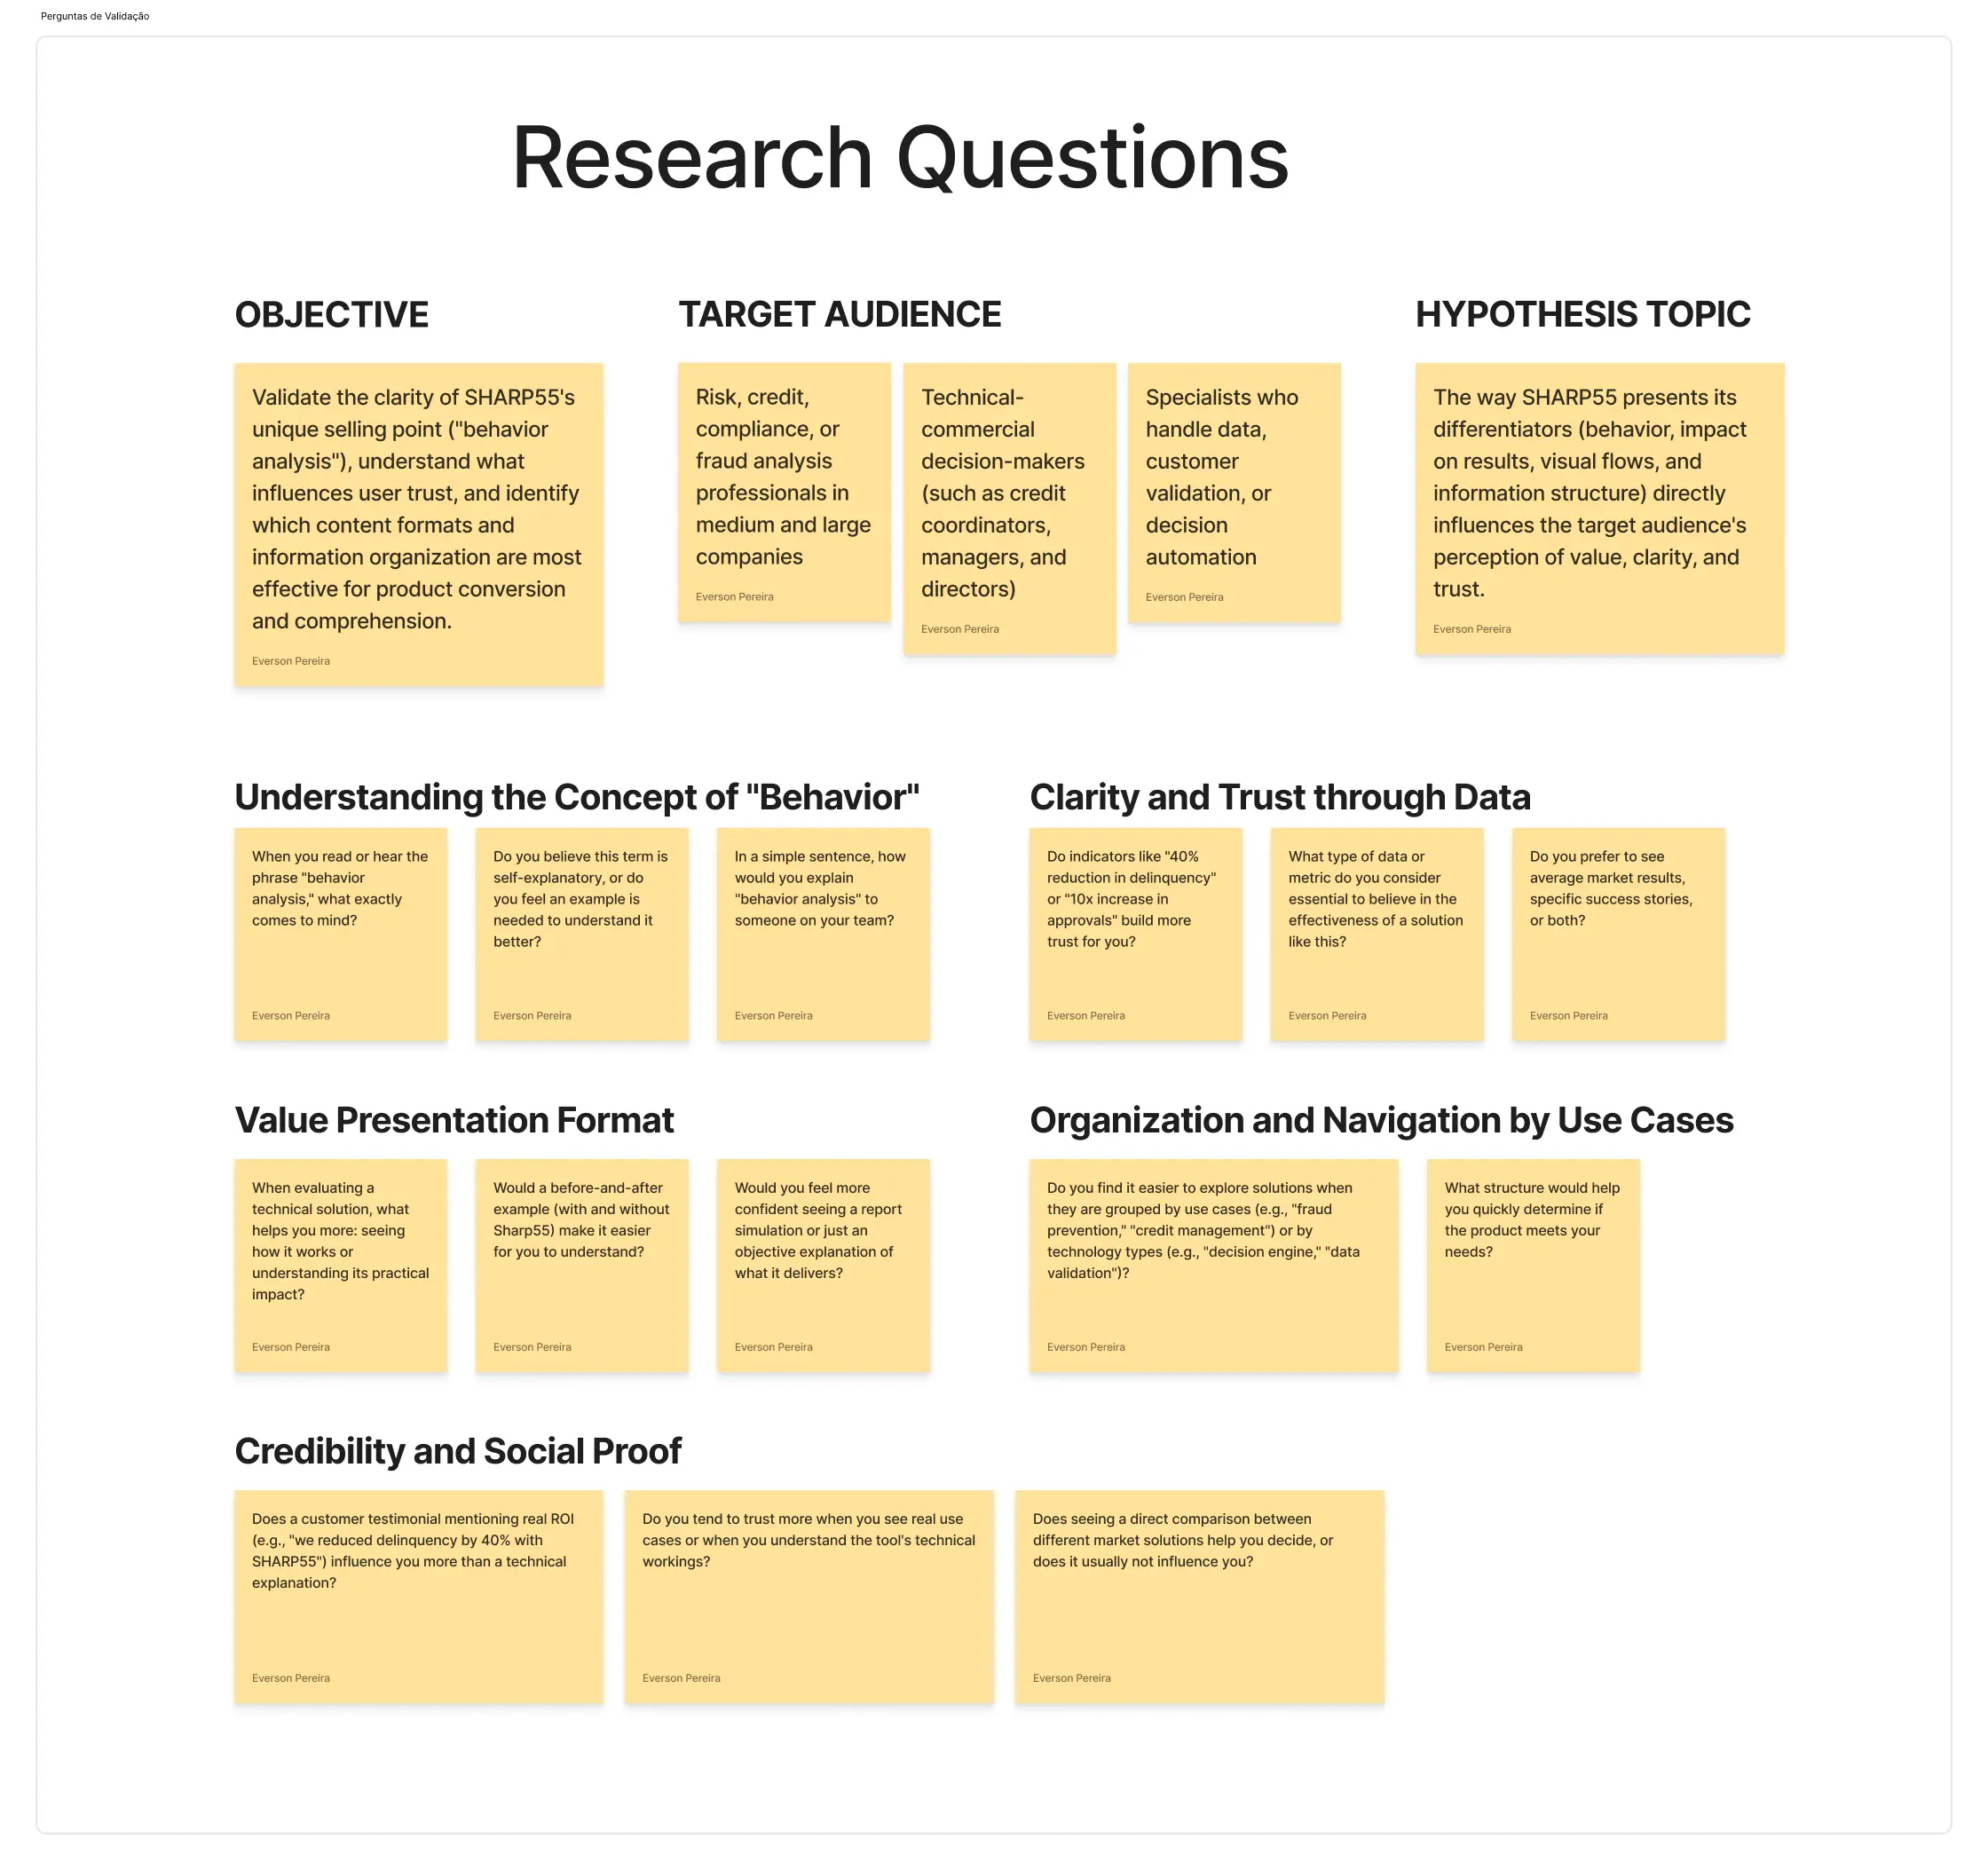
To validate our hypotheses, I conducted remote interviews with enterprise decision-makers and credit analysts recruited through professional networks — decision-makers in credit, risk, and fraud roles — using high-fidelity prototypes and guided conversations. We explored how these users interpreted SHARP55's promise, interface, and terminology.
- Unfamiliar language. Users are unfamiliar with the term "conduct analysis", but resonate with its outcomes when framed as risk prediction before scoring.
- Decision-maker expectations. Decision-makers expect fast understanding, with preference for before/after scenarios instead of technical flows.
- Proof over polish. Visual simplicity helps, but only when paired with quantifiable ROI and operational impact.
- Action-oriented monitoring. The term "monitoramento" (monitoring) sparked positive interest when tied to alert-based action.
These insights reinforced the need to reframe product education into business narratives, using storytelling that connects conduct analysis to risk reduction, faster assessment workflows, and revenue growth.
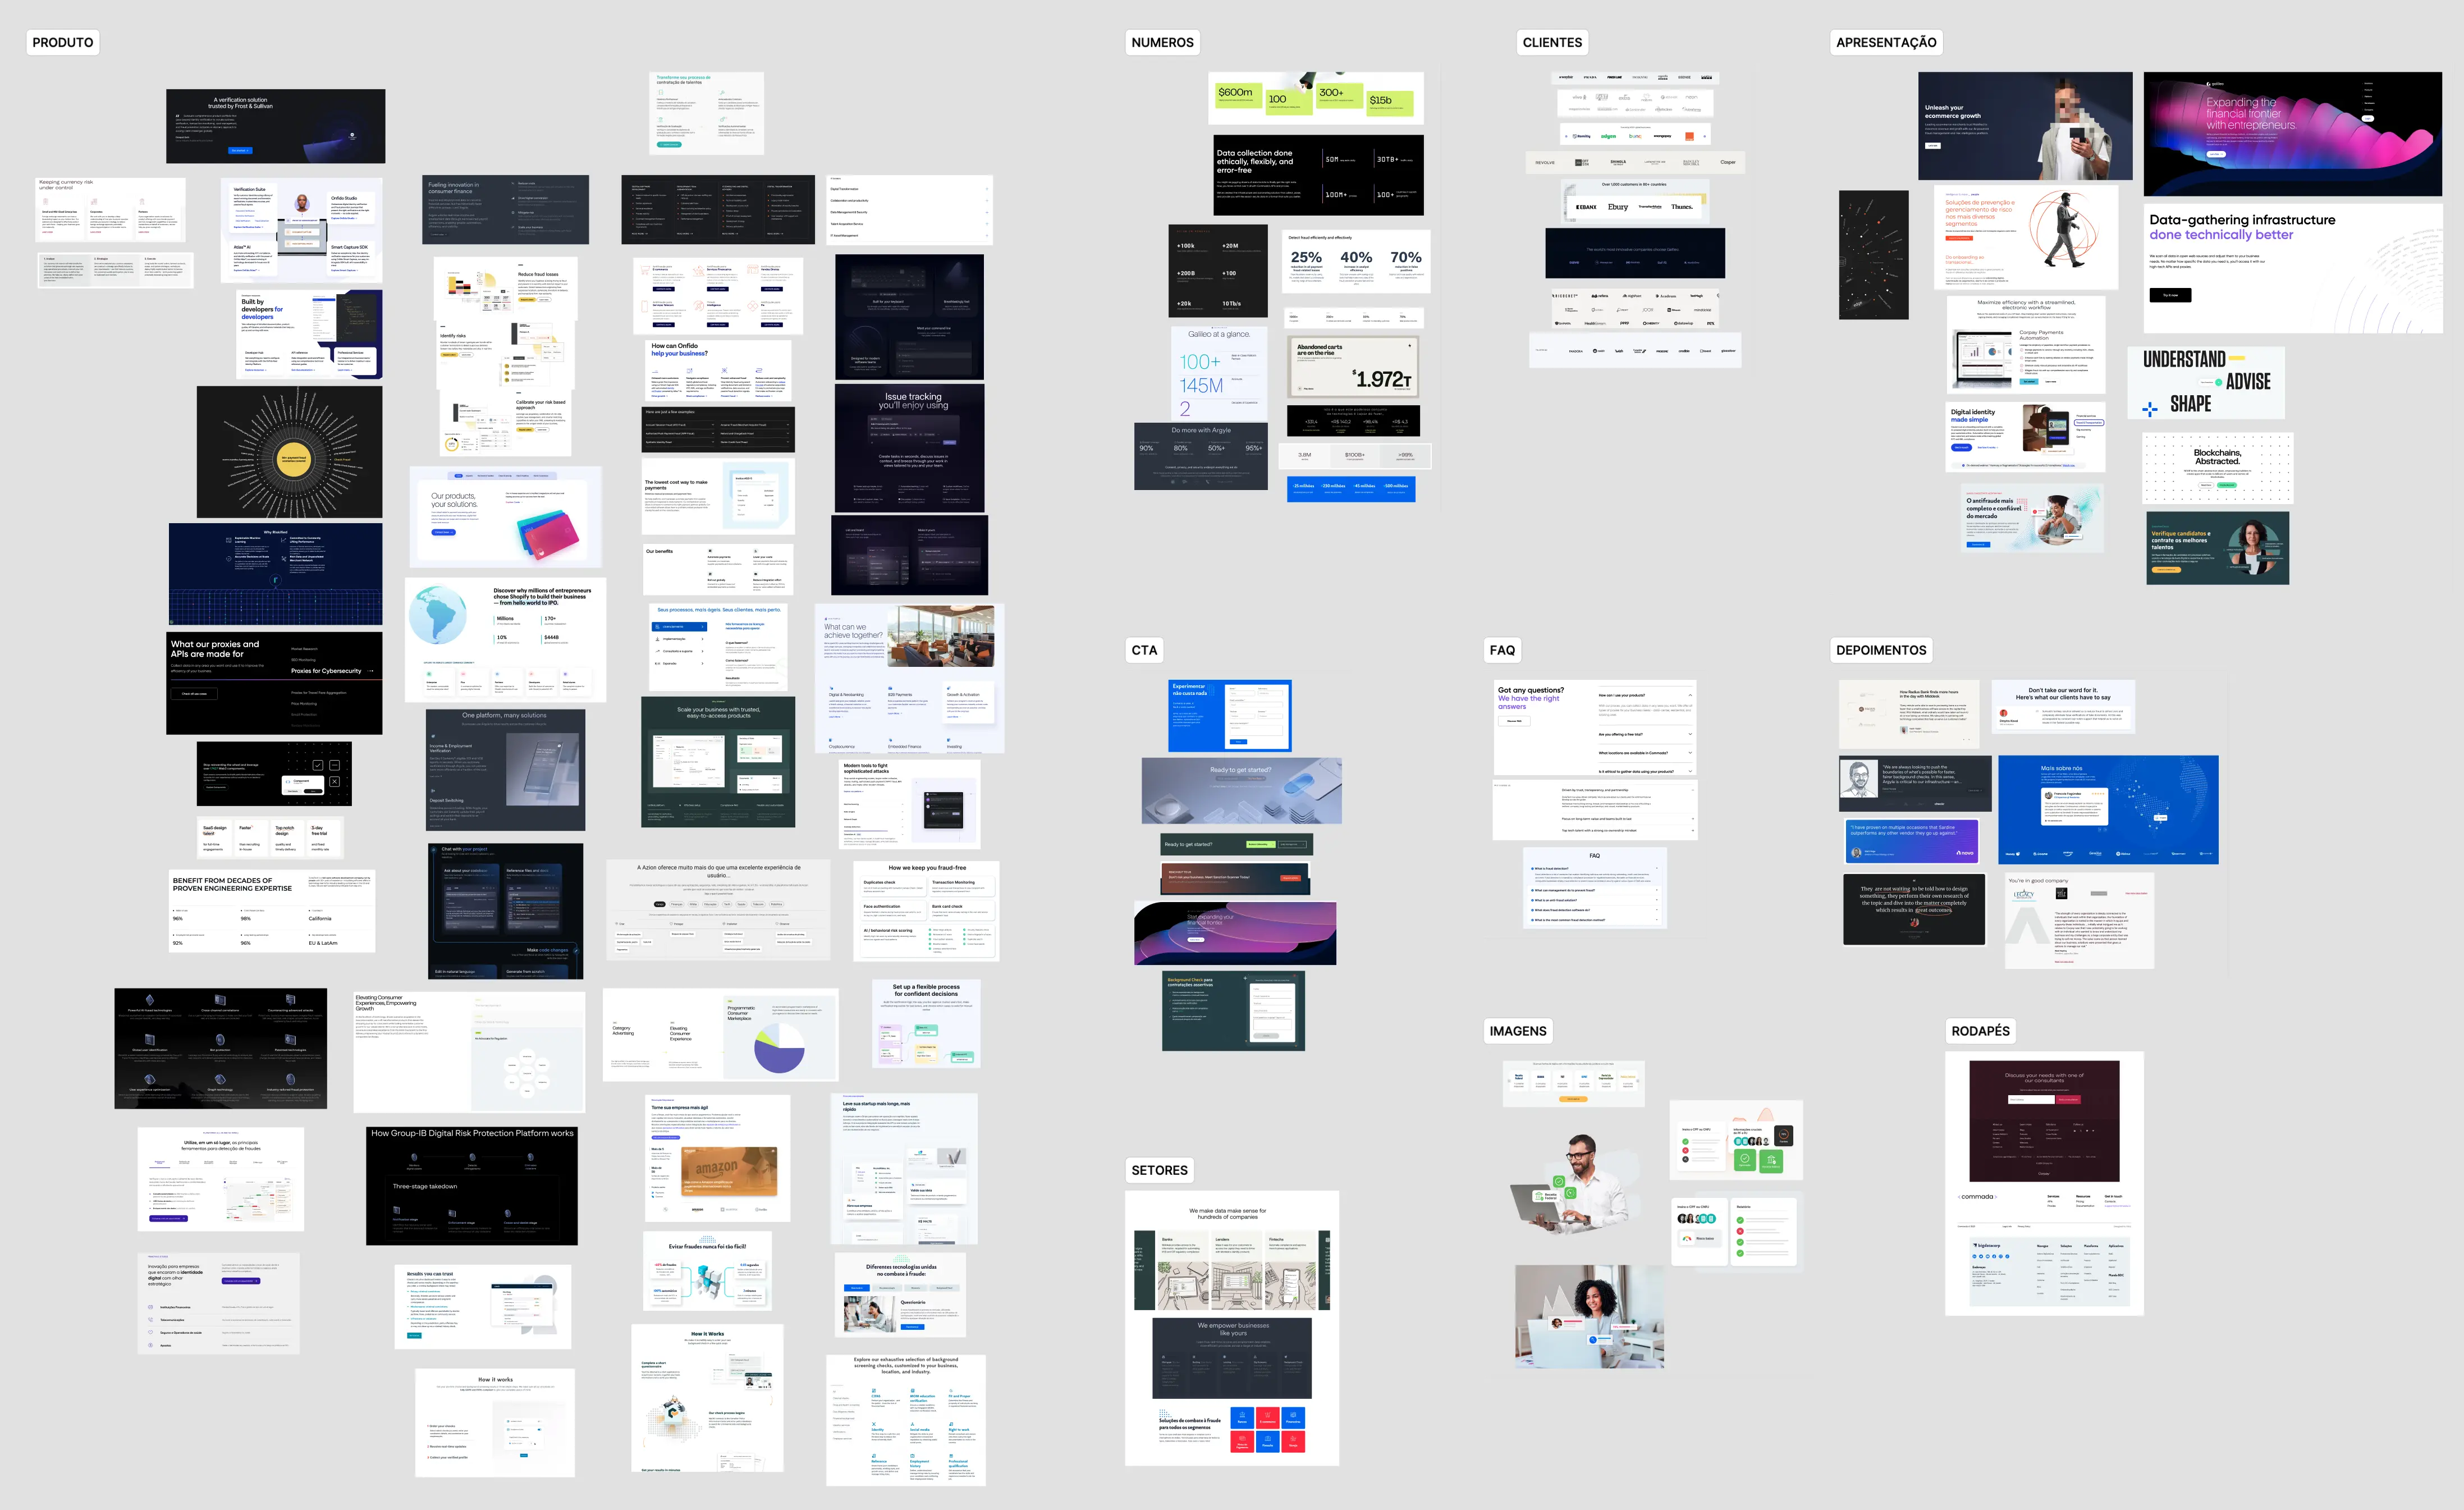
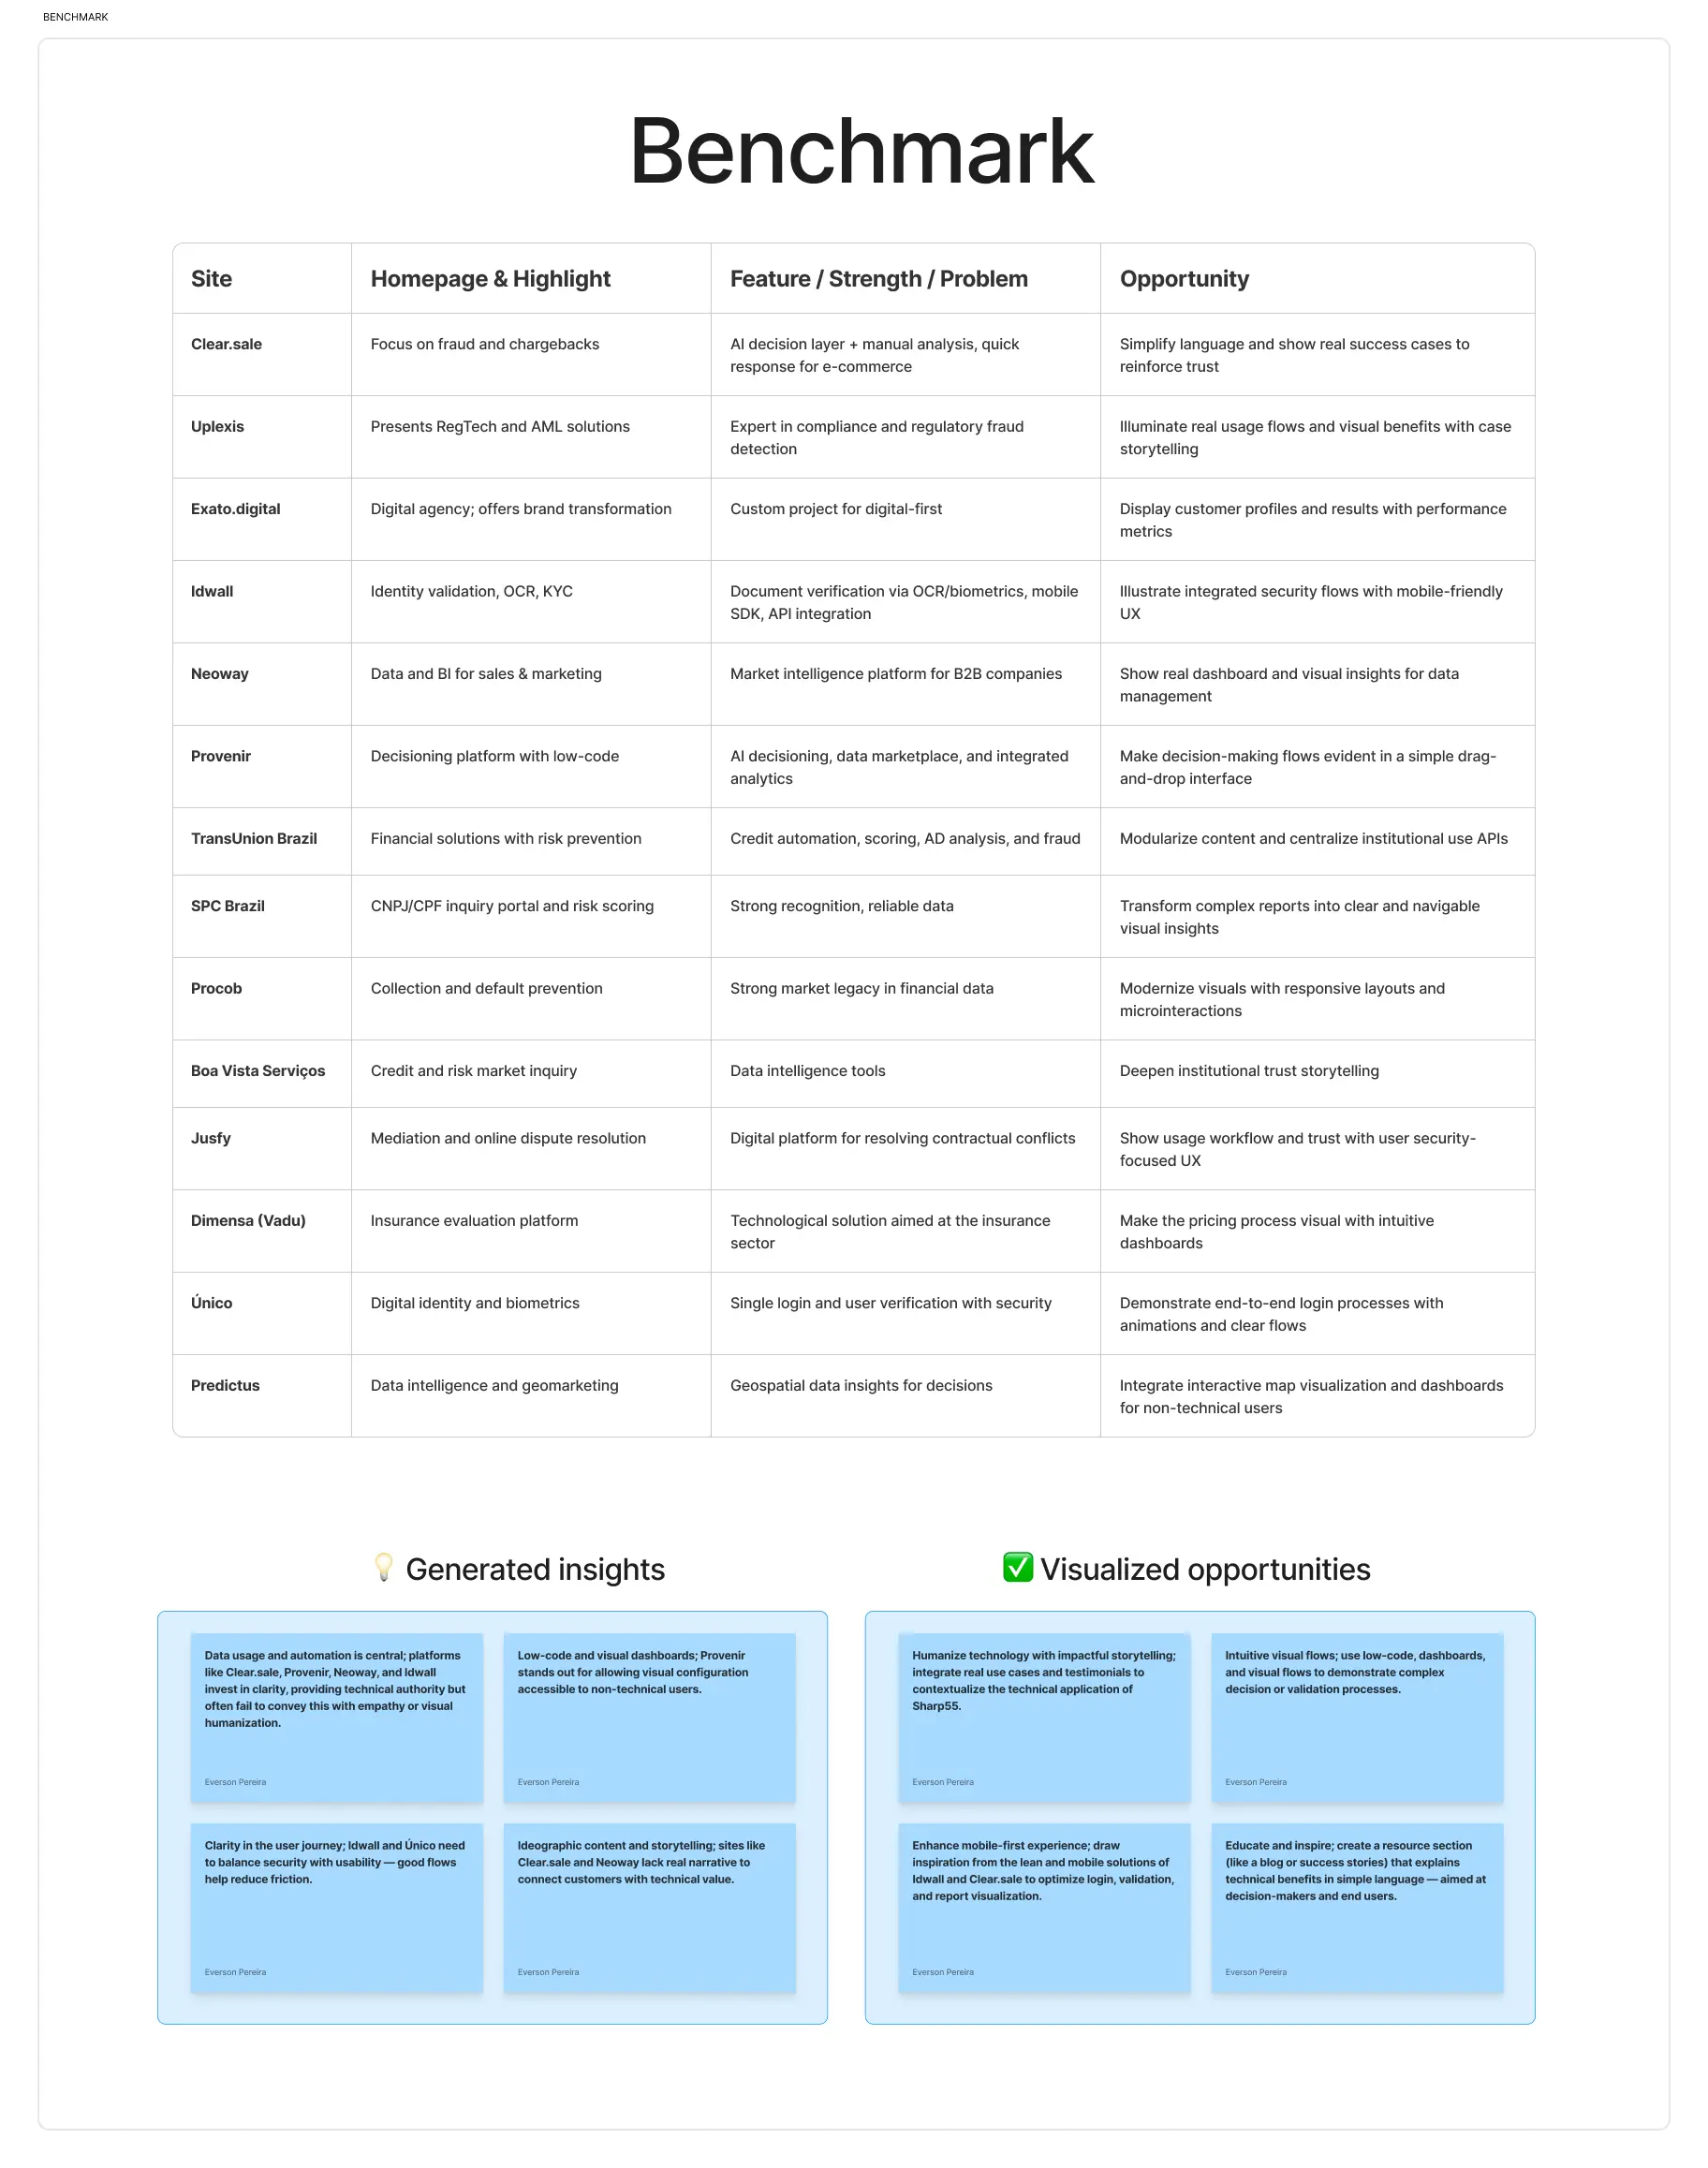
In a saturated market of credit scoring and risk analytics platforms, standing out requires more than advanced technology — it demands clarity, positioning, and trust. I benchmarked 14 competitors across fraud prevention, credit intelligence, risk analysis automation, and compliance. Platforms like ClearSale, Idwall, Neoway, TransUnion, Provenir, and Uplexis revealed consistent gaps: complex messaging, overuse of technical jargon, and underuse of storytelling around product impact.
While many of these tools claim reliability, very few manage to translate data into confidence or explain why their insights matter at a business level. This analysis uncovered a key opportunity: position SHARP55 as the only solution focused on behavioral and reputational conduct, with a language that balances performance, risk mitigation, and strategic ROI.
- Beyond scores and restrictions. The only platform that reveals real behavior through judicial and conduct data, not just financial history.
- Multi-area risk coverage. Identifies risk across credit, legal, logistics, HR, financial, and operational fronts.
- Automated combined analysis. Joins legal, reputational, and behavioral data into one automated workflow.
- Proven financial impact. Up to 40% reduction in default and 89% reduction in operational analysis costs.
- Compliance-ready auditability. Traceable reports and transparent decisions for internal and external audits.
- 29 years of expertise. Deep accumulated knowledge in credit risk, legal behavior, and reputational analysis.
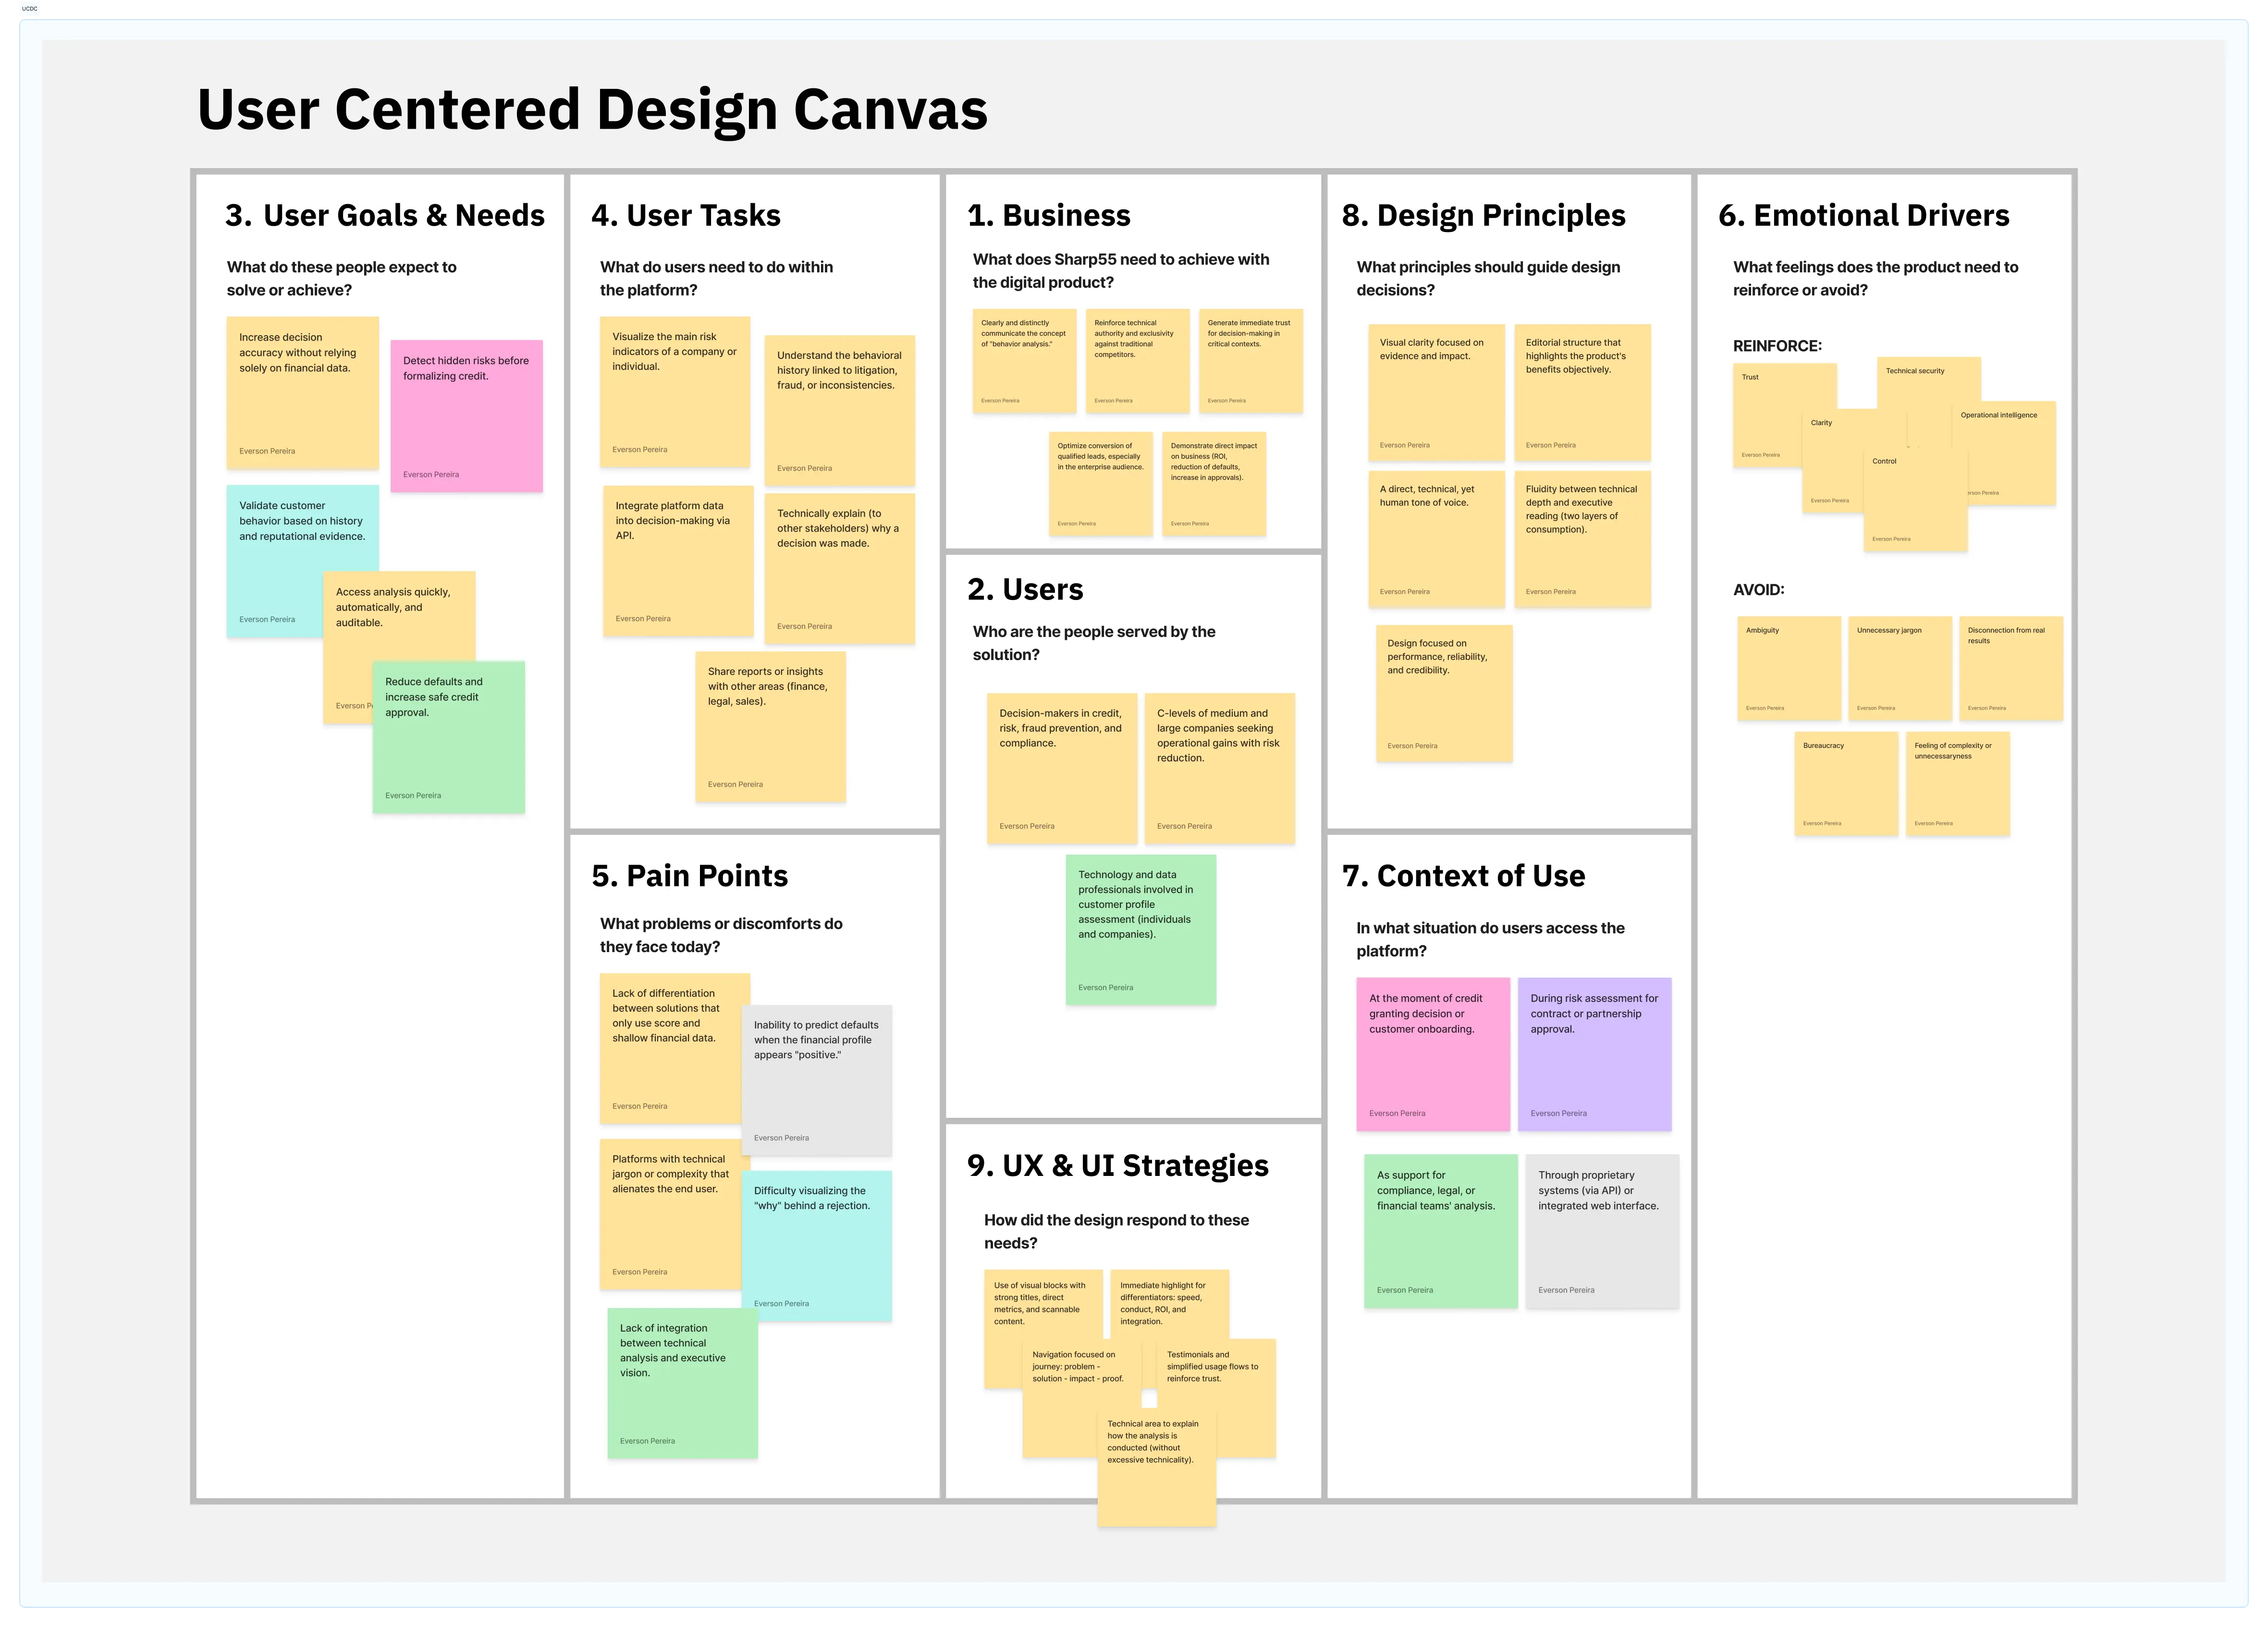
To align SHARP55’s interface and messaging with user expectations, I structured a full UCDC, connecting user profiles, tasks, context, pain points and business goals. The canvas helped structure SHARP55’s UX flow into progressive layers of trust: from clear messaging and differentiators, to real examples, and finally integration and technical depth. Design became a tool to translate intelligence into confidence.
- Business goals. Emphasize performance (ROI, speed, compliance) and reduce manual analysis costs.
- User needs. Clarity, trust, and proof that SHARP55 reveals what traditional credit tools miss.
- Tasks. Understand risks before scoring, simulate client behavior, and monitor ongoing exposure.
- Pain points. Technical language, fragmented tools, over-reliance on financial-only signals.
- Emotional drivers. Confidence, authority, and strategic decision-making, while avoiding fear-based messaging.
Three decisions defined the direction of SHARP55's interface and messaging. Each involved real trade-offs.
| Decision | Rejected | Chosen | Why |
|---|---|---|---|
| Content hierarchy | Features & capabilities first | Use cases & outcomes first | Executives scan for "what changed," not "what it does" |
| Language tone | Technical / legal precision | Narrative clarity with business framing | Jargon hurt credibility with non-specialist buyers |
| Visual density | Dashboards with all data visible | Progressive disclosure, layered depth | Analysts needed focus; executives needed summaries |
These trade-offs came from real tension: the product team wanted feature parity with competitors; the design direction prioritized persuasion. Choosing the latter meant saying no to visible functionality — and betting that clarity would convert better than completeness.
The original platform had dynamic URLs, missing meta tags, and no structured data — making organic discovery nearly impossible. SEO wasn't a post-launch task; it shaped the information architecture from the start.
- Clean URL architecture. Every page, product category, and use case got a readable, keyword-aligned URL structure.
- Schema.org markup. Product, organization, and FAQ structured data were implemented to improve search visibility and rich snippets.
- Heading hierarchy. H1s, H2s, and H3s were mapped to user intent and business priorities, not just visual size.
- Content hub. Risk intelligence topics were grouped into a content architecture that supports long-tail discovery and positions SHARP55 as a category authority.
- Internal linking. Use case pages, product pages, and proof points were connected to distribute authority and guide the buyer journey.
The hardest part of the project was designing through uncertainty. The product was still evolving while the interface needed to feel finished.
Constraint. I had to design a consistent interface while the backend was being rebuilt — meaning some flows changed mid-process. The solution was a flexible design system that absorbed changes without breaking visual coherence.
The site and product experience were structured to highlight outcomes first — fewer defaults, faster approvals, real-time risk insights. Content was grouped by purpose, not tech. Each section was built to deliver fast understanding for executives, with deeper layers for technical users.
The goal wasn’t to explain what SHARP55 does but to show what changes when it’s used. I focused on outcome-first communication: KPIs, before/after flows, and real-world cases. Features were grouped by use case, not tech. Language was stripped of jargon and built around trust, not detail. The strategy: deliver insight, not interface.
The platform offering is organized around clear, traceable services:
- Predictive conduct analysis platform. Core risk intelligence engine with behavioral and judicial signals.
- Behavior-based risk alerts. Early warnings triggered by changes in conduct and legal information.
- Automated legal, reputational, and operational analysis. Multi-domain risk assessment in one workflow.
- ERP, CRM, and decision engine integration. Native connectivity without replacing existing systems.
- Real-time monitoring across multiple areas. Credit, fraud, legal, HR, logistics, and operations in one view.
- Technical reports with audit justifications. Every output is documented for internal review and compliance.
- Content and education on conduct and legal risk. Resources that position SHARP55 as a category authority.
This project reinforced that “conduct” only works when tied to outcome; executives decide in seconds, not slides; clarity converts better than complexity; and the page layout is as persuasive as the product.
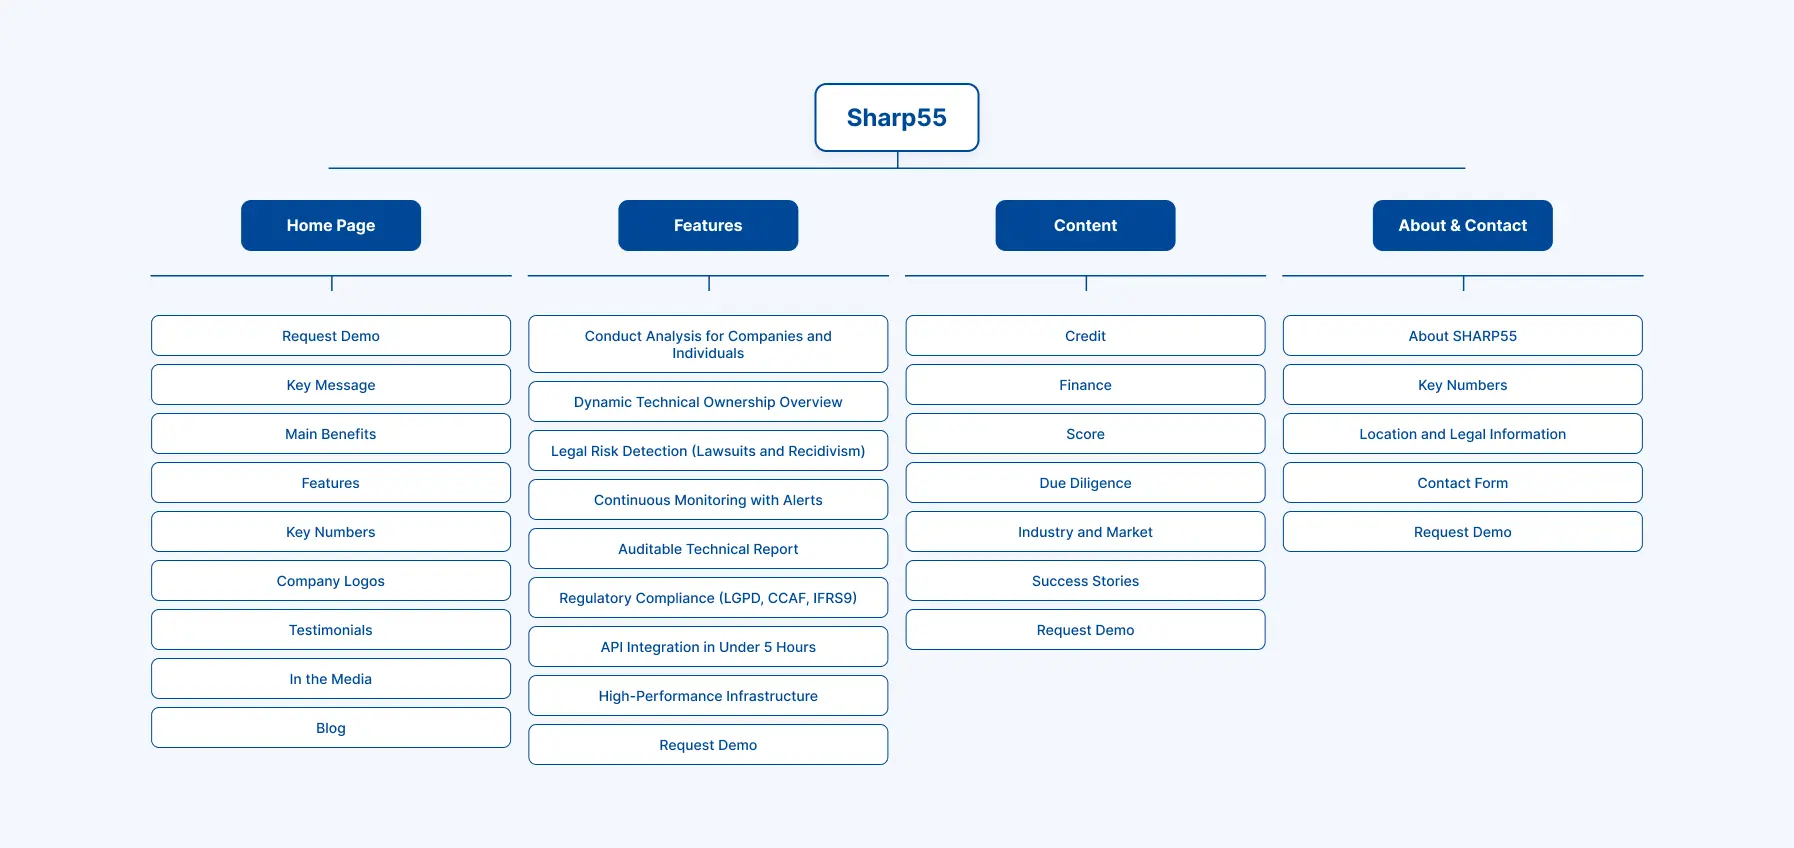
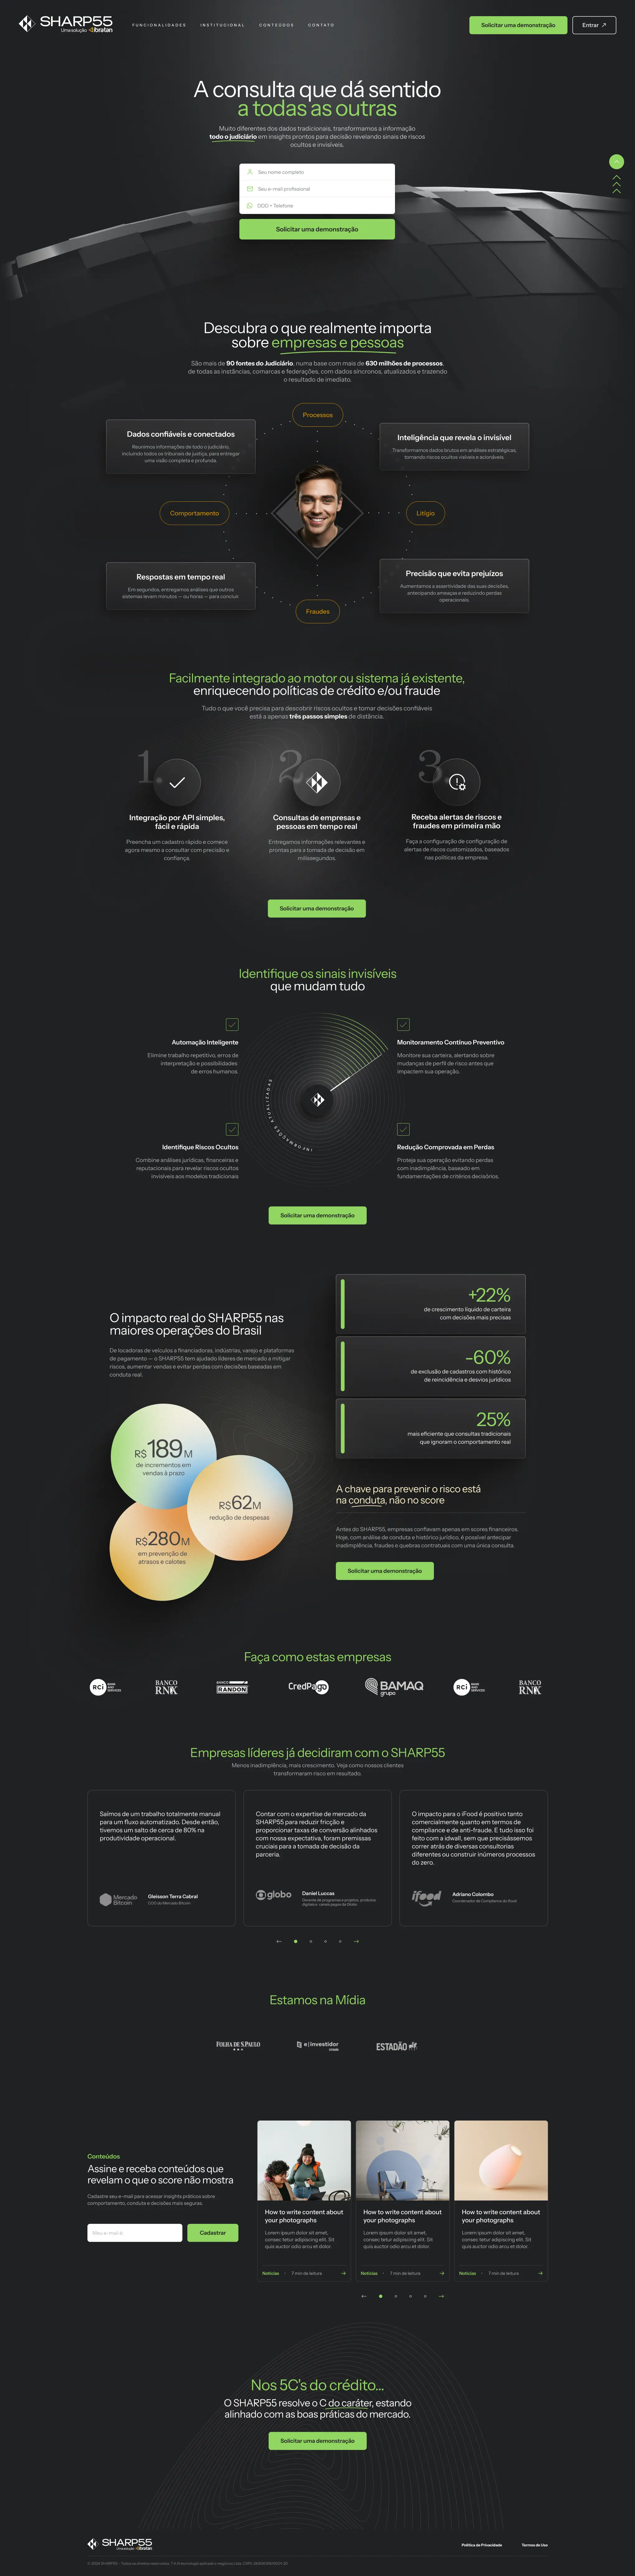



Beyond the screens, the most significant shift was strategic: the site was restructured to sell outcomes before features — changing how the market perceives conduct intelligence.
SHARP55 challenged me to operate at the intersection of visual clarity, technical complexity, and strategic positioning. More than designing interfaces, the project demanded translation of invisible logic into visible confidence — a product that doesn't just show data, but reveals meaning.
Conduct analysis is becoming the new standard of excellence in operational and financial decisions. SHARP55 leads that transformation with precision, speed, and reliability, being the only solution on the market that reveals invisible risks through the actual conduct of companies and people across multiple areas.
This case reinforced my belief that design leadership in high-stakes environments is about creating clarity where ambiguity is risky. SHARP55 was not only a design delivery, it was a business enabler, helping teams reach faster, more confident decisions with better information in one of the most sensitive areas of any organization: risk.